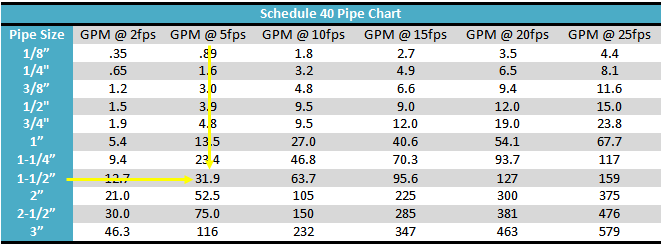
Gpm Water Flow Through Pipe Chart
Frequently Asked Questions About GPM Water Flow Through Pipe Charts
Understanding water flow through pipes is essential for many reasons, from ensuring adequate water pressure in your home to designing efficient plumbing systems in commercial buildings. GPM (Gallons Per Minute) water flow charts are valuable tools for this purpose. This FAQ aims to answer common questions about these charts and how to use them effectively.
What is a GPM Water Flow Through Pipe Chart, and Why is it Important?
A GPM water flow through pipe chart is a visual reference tool that shows the relationship between the flow rate of water (measured in gallons per minute or GPM), the pipe diameter, and the pressure loss (measured in PSI or pounds per square inch) due to friction as water travels through the pipe. These charts are crucial for:
- Designing Plumbing Systems: Ensuring pipes are adequately sized to deliver the required water flow to fixtures and appliances.
- Troubleshooting Water Pressure Issues: Identifying potential bottlenecks in the plumbing system.
- Optimizing System Efficiency: Minimizing pressure loss and energy consumption in pumping systems.
- Predicting System Performance: Forecasting how changes to the system will affect flow and pressure.
- Ensuring Code Compliance: Meeting local plumbing codes regarding minimum flow rates and pressure requirements.
Without a GPM chart, estimating the correct pipe size can be difficult and lead to undersized pipes (resulting in low pressure) or oversized pipes (resulting in wasted materials and potentially stagnant water).
How Do I Read a GPM Water Flow Through Pipe Chart?
Reading a GPM water flow through pipe chart involves understanding the different axes and curves on the chart. Here's a general guide:
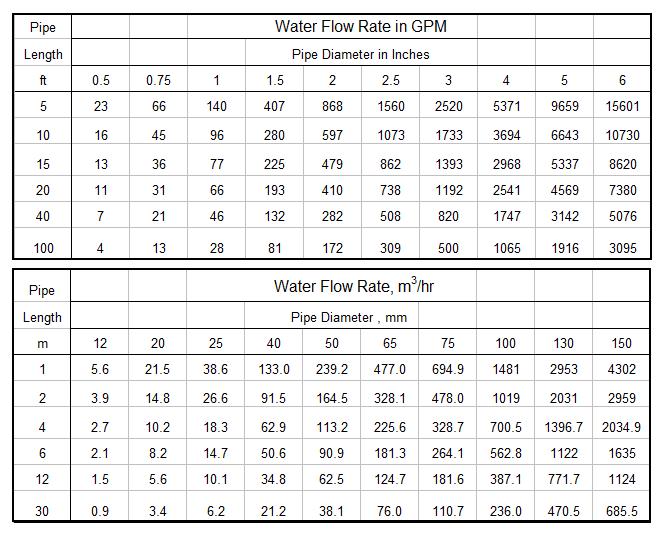
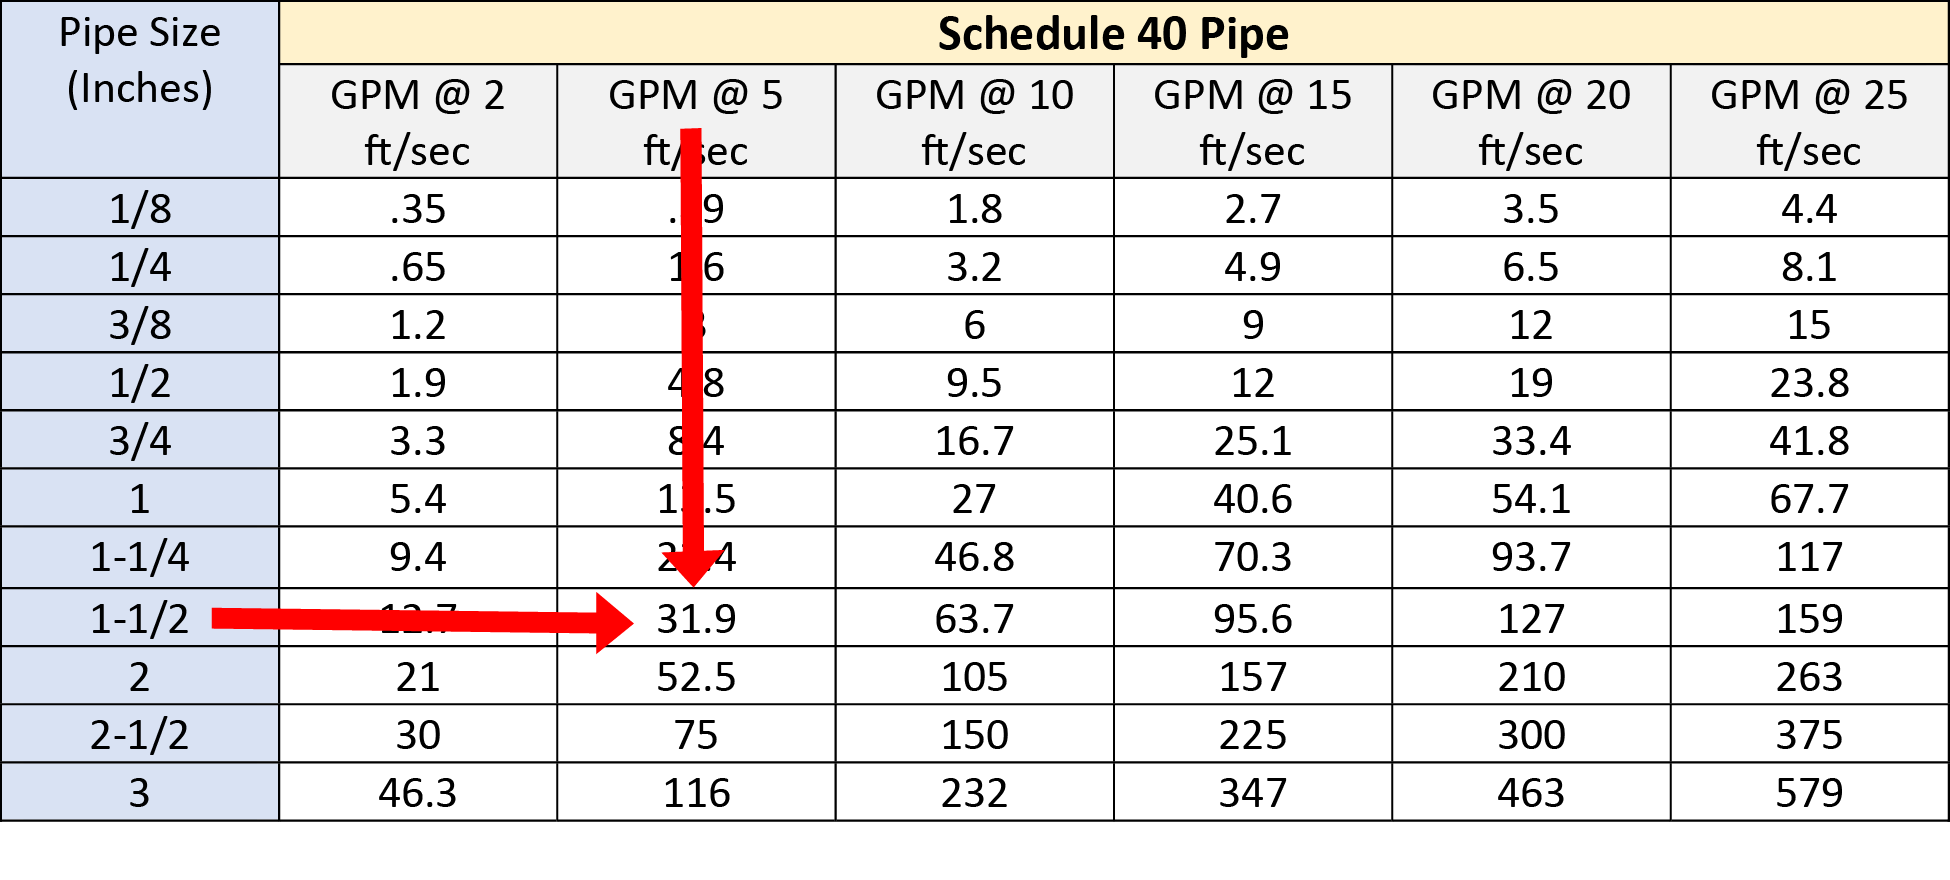
- Pipe Diameter: Typically listed along the top or bottom of the chart, representing the inside diameter of the pipe (usually in inches).
- Flow Rate (GPM): Usually listed along the side of the chart, representing the volume of water flowing through the pipe per minute.
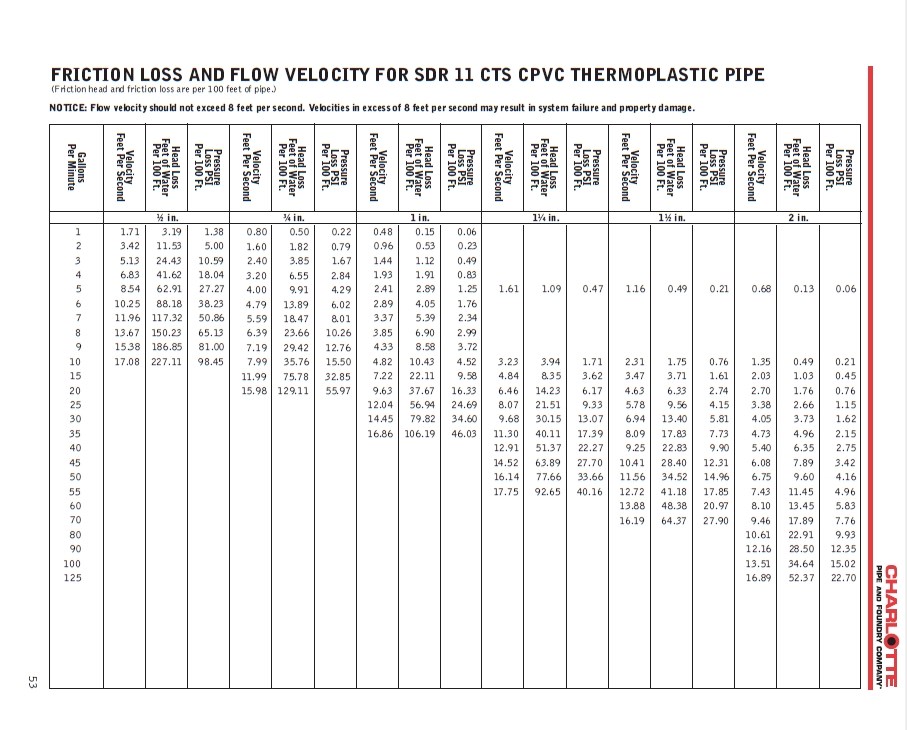
- Pressure Loss (PSI per 100 feet): Represented by a series of curves or lines on the chart. Each curve corresponds to a specific pressure loss per 100 feet of pipe. It is typically expressed as 'PSI/100ft'
- Pipe Material: Charts are often specific to a particular pipe material (e.g., copper, PVC, PEX) because different materials have different roughness, which affects friction loss.
To use the chart, you would typically follow these steps:
- Determine the Required Flow Rate (GPM): Estimate the peak water demand based on the number of fixtures and appliances that might be used simultaneously.
- Choose a Pipe Material: Select the appropriate chart based on the pipe material you are using (e.g., copper, PVC, PEX).
- Locate the Flow Rate on the Chart: Find the desired GPM value on the flow rate axis.
- Identify Acceptable Pressure Loss: Determine the maximum acceptable pressure loss per 100 feet of pipe. This will depend on the overall system design and the desired water pressure at the fixtures.
- Find the Intersection: Find the intersection of the flow rate and the pressure loss curve.
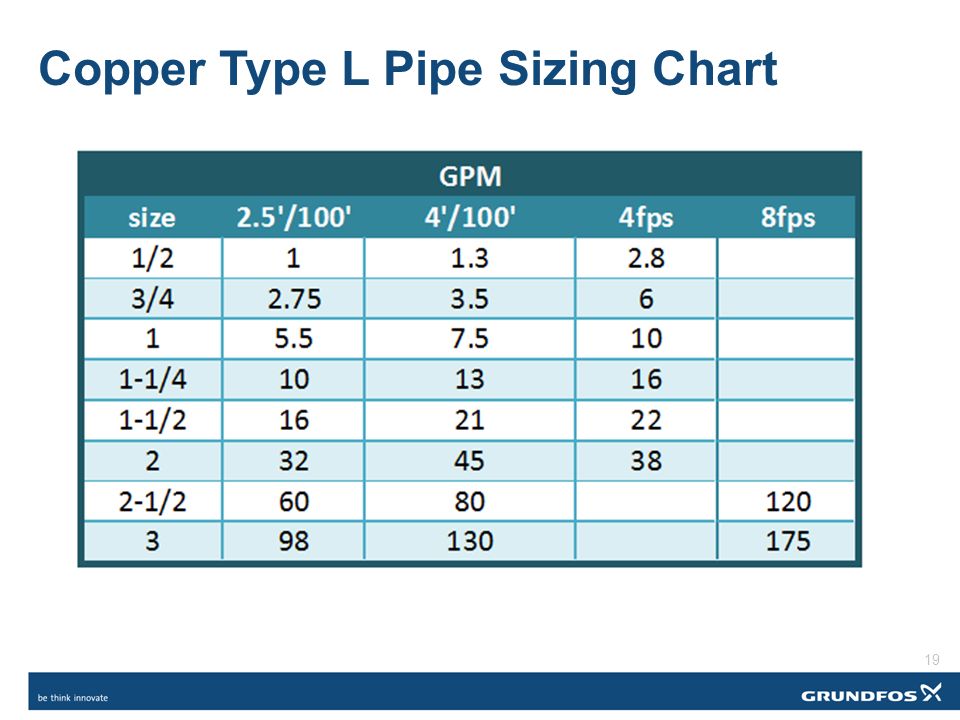
- Determine the Pipe Diameter: Read the pipe diameter from the axis closest to the intersection point. If the intersection falls between two pipe sizes, it's generally recommended to choose the larger size to minimize pressure loss.
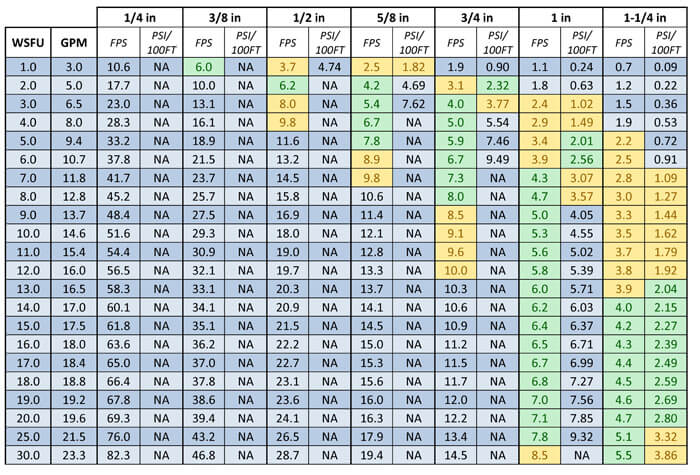
Example: Let's say you need a flow rate of 10 GPM and are using a copper pipe chart. You determine that a pressure loss of 4 PSI per 100 feet is acceptable. You locate 10 GPM on the flow rate axis and find the 4 PSI/100ft curve. The intersection point is closest to the 1-inch pipe diameter. Therefore, a 1-inch copper pipe would likely be suitable.
What Factors Affect Water Flow and Pressure Loss in Pipes?
Several factors can influence water flow and pressure loss in pipes. Understanding these factors is crucial for accurate calculations and system design:
- Pipe Diameter: Larger diameter pipes offer less resistance to flow, resulting in lower pressure loss.
- Pipe Material: Different materials have different roughness. Rougher surfaces (like old, corroded steel) create more friction and higher pressure loss compared to smoother surfaces (like copper or PEX).
- Flow Rate: Higher flow rates increase friction and pressure loss.
- Pipe Length: The longer the pipe, the greater the total pressure loss. Charts typically show pressure loss per 100 feet, so you need to adjust for the actual pipe length.
- Fittings and Valves: Bends, elbows, tees, valves, and other fittings introduce additional resistance to flow, increasing pressure loss. Each fitting has an equivalent length of straight pipe that represents its resistance.
- Water Temperature: Water viscosity changes with temperature. Colder water is more viscous, resulting in slightly higher pressure loss.
- Elevation Changes: Changes in elevation affect pressure. Water pressure decreases as elevation increases and increases as elevation decreases.
Most GPM charts primarily account for pipe diameter, flow rate, and pipe material. The effects of fittings, valves, and elevation changes are usually calculated separately and added to the pressure loss obtained from the chart.
Where Can I Find Reliable GPM Water Flow Through Pipe Charts?
Reliable GPM water flow through pipe charts can be found from several sources:
- Pipe Manufacturers: Most pipe manufacturers (e.g., copper tubing manufacturers, PVC pipe manufacturers, PEX pipe manufacturers) provide detailed flow charts and sizing guides specific to their products. These are often the most accurate sources.
- Plumbing Code Books: Local and national plumbing codes (e.g., the Uniform Plumbing Code, the International Plumbing Code) often include flow rate tables and guidelines for pipe sizing.
- Engineering Handbooks: Civil and mechanical engineering handbooks contain comprehensive data on fluid flow and pipe sizing.
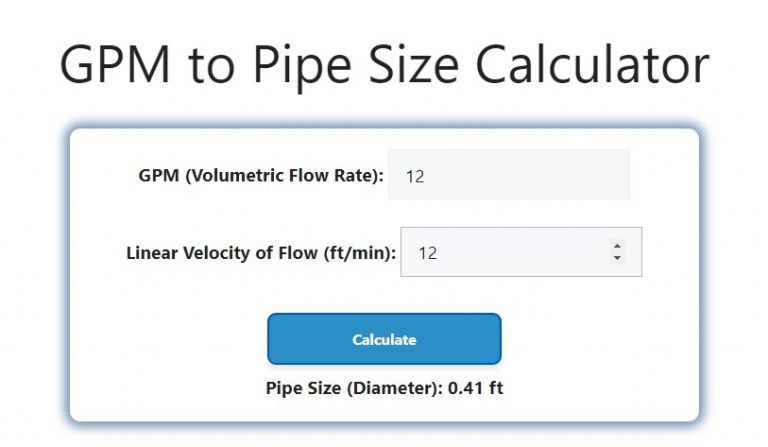
- Online Calculators and Resources: Many websites offer online calculators that can estimate pressure loss based on pipe size, flow rate, and other factors. However, it is crucial to verify the accuracy and reliability of these calculators.
- Plumbing Supply Stores: Some plumbing supply stores provide printed charts or access to manufacturer's data.
When selecting a chart, make sure it specifies the pipe material, units of measurement (GPM, PSI), and any other relevant information. Be wary of charts that seem overly simplified or lack clear documentation.
What are Some Common Mistakes to Avoid When Using GPM Charts?
Using GPM charts correctly requires attention to detail. Here are some common mistakes to avoid:
- Using the Wrong Chart for the Pipe Material: Using a copper pipe chart for PVC pipe, or vice versa, will lead to inaccurate results due to differences in pipe roughness.
- Ignoring Fittings and Valves: Forgetting to account for the additional pressure loss caused by fittings and valves will underestimate the total pressure loss.
- Ignoring Elevation Changes: Neglecting elevation changes, especially in systems with significant vertical runs, can lead to incorrect pressure calculations.
- Using the Outside Diameter Instead of the Inside Diameter: The chart is based on the inside diameter of the pipe. Using the outside diameter will lead to errors.
- Not Accounting for Pipe Age and Condition: Over time, pipes can corrode or accumulate scale, which increases roughness and reduces flow capacity. Older systems may require larger pipe sizes to compensate.
- Oversimplifying Flow Rate Estimates: Underestimating the peak water demand can lead to undersized pipes and low water pressure. It's important to consider the maximum possible simultaneous use of fixtures and appliances.
- Misinterpreting the Chart: Carefully read and understand the axes and curves on the chart. Pay attention to the units of measurement (GPM, PSI/100ft).
How Do I Account for Fittings and Valves When Using a GPM Chart?
To account for fittings and valves, you need to determine their equivalent length in feet of straight pipe. This equivalent length represents the additional resistance to flow caused by the fitting or valve. Here's the general process:
- Identify All Fittings and Valves: List all the fittings and valves in the pipe run (e.g., elbows, tees, couplings, valves).
- Obtain Equivalent Length Data: Find the equivalent length for each fitting and valve. This data can usually be found in manufacturer's catalogs, engineering handbooks, or online resources. The equivalent length is typically expressed in feet.
- Calculate Total Equivalent Length: Sum the equivalent lengths of all fittings and valves in the pipe run.
- Add to Actual Pipe Length: Add the total equivalent length to the actual length of the pipe. This gives you the total effective length of the pipe run.
- Use the Total Effective Length in Pressure Loss Calculations: Use the total effective length to calculate the pressure loss using the GPM chart. Since the chart typically shows pressure loss per 100 feet, you can multiply the chart value by (Total Effective Length / 100).
Example: Suppose you have a 50-foot run of pipe with three 90-degree elbows and one gate valve. You find that each 90-degree elbow has an equivalent length of 5 feet, and the gate valve has an equivalent length of 2 feet. The total equivalent length is (3 elbows * 5 feet/elbow) + 2 feet (valve) = 17 feet. The total effective length is 50 feet (actual pipe length) + 17 feet (equivalent length) = 67 feet. You would then use 67 feet in your pressure loss calculations.
Is There a Simple Rule of Thumb for Estimating Pipe Size?
While GPM charts offer the most accurate method, a very rough rule of thumb for residential plumbing is to use the following guidelines:
- ½-inch pipe: Suitable for individual fixtures like sinks and toilets. Limited to a low GPM flowrate.
- ¾-inch pipe: Suitable for supplying water to a small bathroom group (sink, toilet, shower). Can handle a moderate GPM flowrate.
- 1-inch pipe: Suitable for the main water supply line to a typical single-family home. Offers a higher GPM flowrate for the whole house.
However, this is a highly simplified guideline and should not be used for critical applications or when precise flow rates are required. Always use a GPM chart and consider all relevant factors for accurate pipe sizing. Moreover, this does not account for the length of the pipe run or pressure demands.
In summary, GPM water flow through pipe charts are indispensable tools for designing and troubleshooting plumbing systems. By understanding how to read and use these charts, and by considering all relevant factors, you can ensure adequate water pressure, optimize system efficiency, and avoid costly mistakes.