How To Read Pump Performance Curve
Understanding Pump Performance Curves: A Comprehensive Guide
Whether you're a homeowner trying to optimize your heating system, an HVAC technician troubleshooting a commercial chiller, or a facility manager overseeing a large building's climate control, understanding pump performance curves is crucial. These curves are graphical representations of a pump's capability, showing the relationship between flow rate and head (pressure). In simple terms, they tell you how much fluid a pump can move at a specific pressure.
What are Head and Flow Rate?
Before diving into the curves themselves, let's define these two key terms:
- Head (Total Dynamic Head - TDH): This is the total equivalent height a pump can lift a fluid. It's essentially the pressure the pump needs to overcome to move the fluid through the system. Head is typically measured in feet (ft) or meters (m) of fluid. Factors contributing to head include:
- Static Head: The vertical distance the fluid needs to be lifted.
- Friction Head: The pressure loss due to friction within the pipes, fittings, and equipment. Longer pipe runs, smaller pipe diameters, and more fittings increase friction head.
- Pressure Head: Any pressure difference between the pump's inlet and outlet.
- Flow Rate: This is the volume of fluid the pump moves per unit of time. It's usually measured in gallons per minute (GPM) in the US or liters per second (L/s) in metric systems.
Deconstructing the Pump Performance Curve
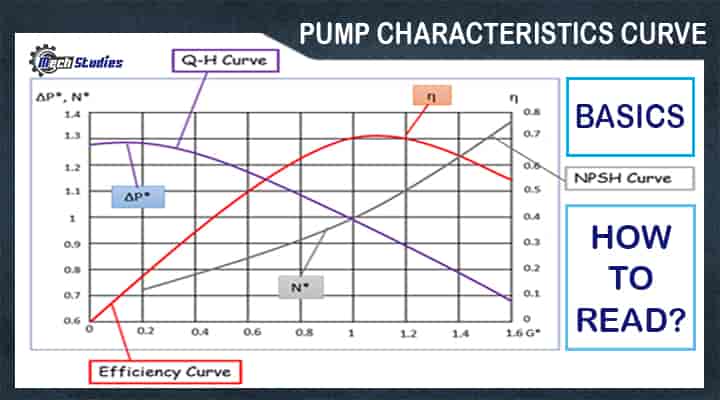
A pump performance curve is a graph with flow rate on the horizontal (x) axis and head on the vertical (y) axis. The curve itself is a line that slopes downwards from left to right. This shows that as the flow rate increases, the head (pressure) that the pump can generate decreases.
Key Elements of a Pump Curve:
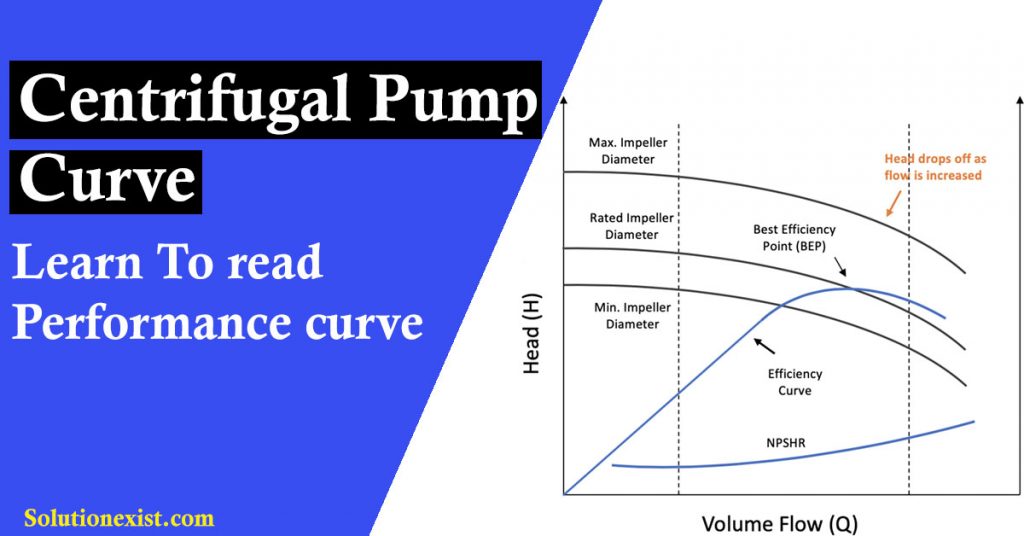
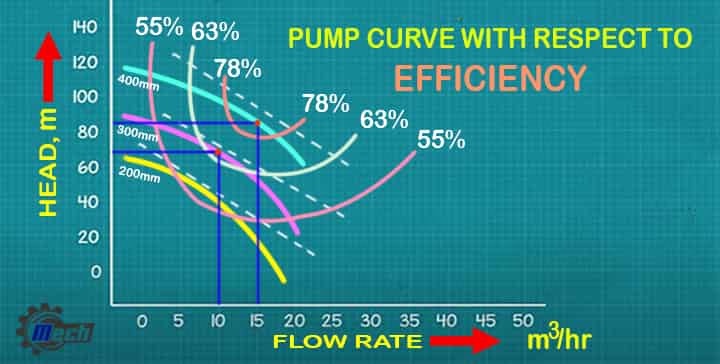
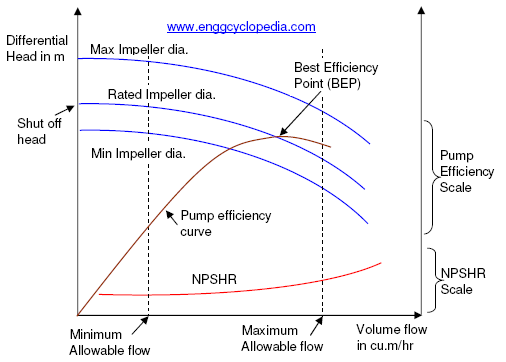
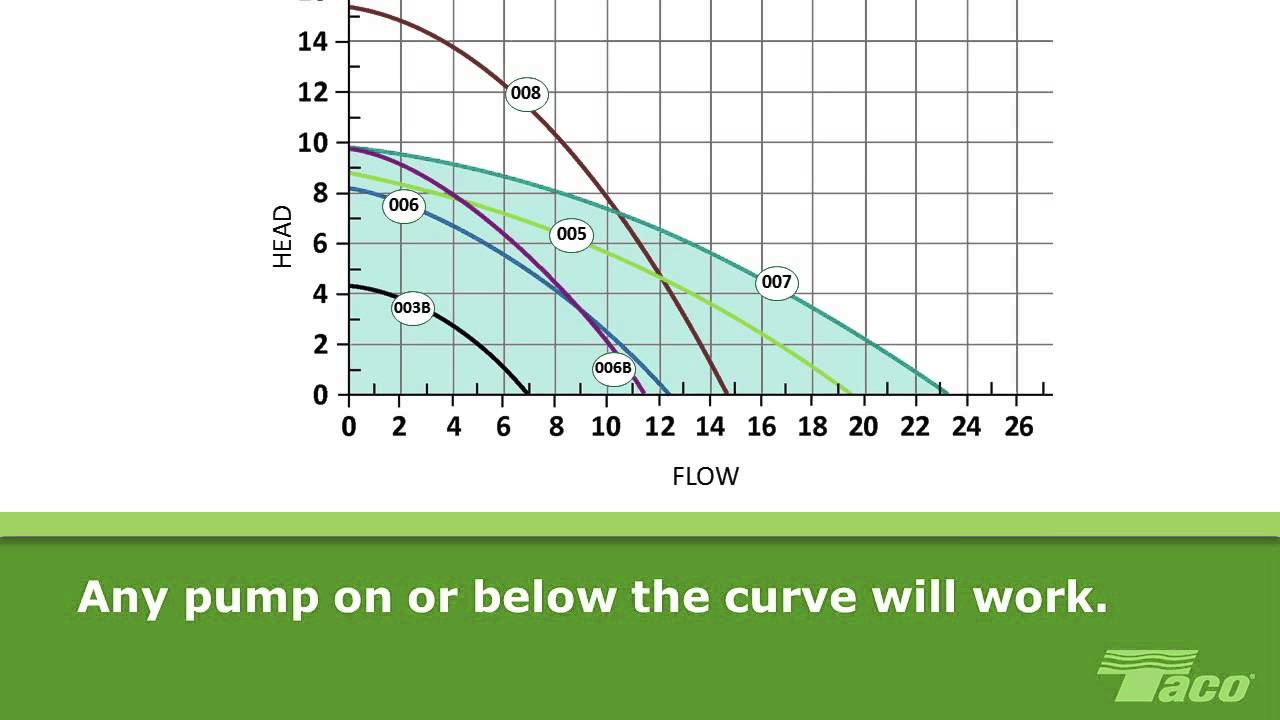
- The Pump Curve (H-Q Curve): The main curve on the graph. It represents the pump's performance at a specific impeller diameter and speed. Different impeller sizes will have different curves, usually presented on the same graph for comparison. Larger impellers generally produce higher head and flow.
- Shut-off Head: This is the head produced when the flow rate is zero. It's the point where the curve intersects the y-axis. Operating a pump at or near shut-off head for extended periods can damage the pump, as the energy is converted into heat without any fluid movement.
- Maximum Flow Rate: This is the flow rate when the head is zero. It's the point where the curve intersects the x-axis. Operating at maximum flow rate can also be problematic, as the pump may be operating inefficiently and potentially cavitate.
- Best Efficiency Point (BEP): This is the point on the curve where the pump operates at its highest efficiency. The BEP is usually indicated on the curve and is a critical factor in selecting the right pump. Running a pump near its BEP maximizes energy savings and prolongs its lifespan.
- Efficiency Curves: These curves show the pump's efficiency at different flow rates. They usually appear as additional lines on the same graph as the pump curve.
- Power Curves: These curves indicate the power (usually in horsepower or kilowatts) required to operate the pump at different flow rates.
- NPSH Required (NPSHr) Curve: This curve indicates the Net Positive Suction Head required by the pump to avoid cavitation. Cavitation occurs when the pressure at the pump inlet drops too low, causing vapor bubbles to form and collapse, damaging the impeller. We'll discuss NPSH in more detail later.
Reading a Pump Curve: A Step-by-Step Example
Let's say you need a pump that delivers 50 GPM at a head of 40 feet. To find a suitable pump using a performance curve, follow these steps:
- Locate the 50 GPM point on the x-axis (flow rate).
- Locate the 40-foot point on the y-axis (head).
- Find the point where these two lines intersect on the graph.
- Select a pump whose performance curve passes through or very close to this point.
- Important: Check the efficiency curve at 50 GPM. You want a pump where the efficiency is high near this operating point. Aim for operation near the BEP.
Net Positive Suction Head (NPSH) Explained
NPSH is a critical parameter to consider for pump operation, especially in closed-loop systems. It represents the absolute pressure at the suction side of the pump. There are two types of NPSH:
- NPSH Available (NPSHa): This is the actual NPSH present in the system at the pump's suction. It depends on factors like atmospheric pressure, fluid temperature, suction lift, and friction losses in the suction piping.
- NPSH Required (NPSHr): This is the minimum NPSH that the pump needs to operate without cavitation. This value is provided by the pump manufacturer on the performance curve.
Crucially, NPSHa must always be greater than NPSHr. If NPSHa is less than NPSHr, the pump will cavitate, leading to noise, vibration, reduced performance, and ultimately, pump damage. To increase NPSHa, you can raise the liquid level in the supply tank, reduce the suction lift, or decrease the fluid temperature.
System Curves: Matching the Pump to the System
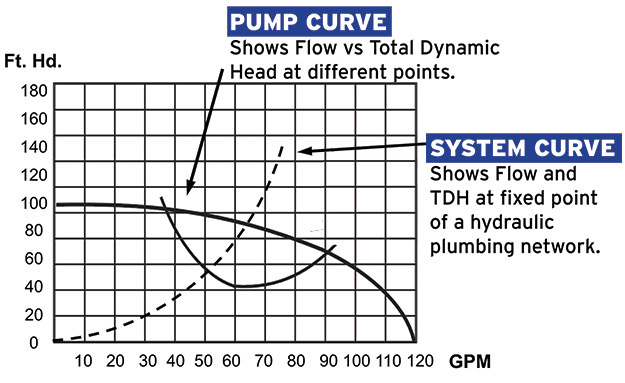
A pump performance curve shows what the pump can do. A system curve shows what the system requires. The system curve represents the relationship between flow rate and head loss in the piping system. To create a system curve, you need to calculate the total head loss in the system at different flow rates.
The point where the pump curve and the system curve intersect is the operating point of the pump in that system. This is the actual flow rate and head that the pump will deliver in that specific application. If the operating point is far from the pump's BEP, the pump will operate inefficiently and may be prone to problems.
Variable Frequency Drives (VFDs) and Pump Performance
VFDs are often used to control the speed of pumps, allowing for variable flow rates and energy savings. Changing the pump speed shifts the pump performance curve. A VFD allows you to match the pump's output to the system's demand, reducing energy consumption, minimizing wear and tear, and improving system control.
When selecting a VFD for a pump, it's crucial to consider the pump's torque requirements and the VFD's capabilities. Not all VFDs are suitable for all pump applications. Also, ensure the motor is VFD-rated.
Pump Selection Considerations
Choosing the right pump involves more than just matching head and flow requirements. Consider the following factors:
- Fluid Type: The viscosity, density, and chemical properties of the fluid can affect pump performance and material compatibility.
- Temperature: High or low fluid temperatures can impact pump materials and performance.
- System Design: Consider the piping layout, elevation changes, and pressure requirements.
- Efficiency: Select a pump that operates efficiently near its intended operating point.
- Cost: Compare the initial cost of the pump with its operating costs (energy consumption, maintenance).
- Reliability: Choose a reputable pump manufacturer with a track record of reliable products.
Troubleshooting with Pump Performance Curves
Pump performance curves can be invaluable for troubleshooting pump problems. If a pump is not performing as expected, comparing its actual performance to its performance curve can help diagnose the issue.
Common Issues and Curve Interpretation:
- Reduced Flow Rate: This could be caused by a clogged impeller, worn impeller, air in the system, or increased system head loss. Check the system curve and compare it to the pump curve.
- Reduced Head: This could be caused by a worn impeller, air in the system, or incorrect pump speed.
- Cavitation: This is indicated by noise, vibration, and a drop in performance. Check NPSHa and ensure it is greater than NPSHr.
- Excessive Power Consumption: This could indicate an inefficient pump, a clogged impeller, or a problem with the motor.
Conclusion
Understanding pump performance curves is essential for selecting, operating, and troubleshooting pumps effectively. By carefully analyzing the curves and considering the system requirements, you can ensure optimal pump performance, energy efficiency, and longevity. Whether you are dealing with a small residential pump or a large industrial pump system, a solid understanding of these concepts will save time, money, and headaches in the long run. Consider investing in training or consulting with an HVAC professional to deepen your knowledge and ensure your systems are running at their best.