How To Read R22 Pressure Temperature Chart

Understanding your HVAC system is crucial, whether you're a homeowner trying to keep your family comfortable, a technician diagnosing a problem, or a facility manager overseeing a large building's climate control. While R22 refrigerant is being phased out, many systems still rely on it. Knowing how to read an R22 pressure-temperature (PT) chart is vital for proper system maintenance and troubleshooting.
What is an R22 Pressure-Temperature Chart?
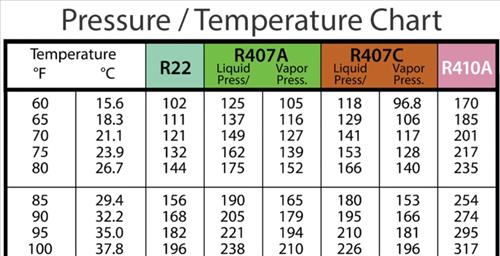
An R22 PT chart, or pressure-temperature chart, is a reference table that shows the relationship between the pressure and temperature of R22 refrigerant in a saturated state. In simple terms, it tells you what pressure corresponds to a specific temperature when the refrigerant is actively changing state (boiling or condensing) within your HVAC system. This is indispensable when diagnosing system issues. If you know either the pressure or the temperature at a certain point in your system, you can look up the corresponding value on the chart.
Why is it important?
The PT chart is a critical tool for determining if your system is properly charged with refrigerant. Undercharging or overcharging can significantly reduce efficiency, damage components, and lead to premature system failure. Using the chart allows technicians to accurately diagnose problems like refrigerant leaks, compressor issues, and airflow restrictions. For facility managers, understanding these relationships ensures informed decisions about maintenance and potential upgrades.
Understanding the Components of the Chart
A typical R22 PT chart will have two main columns:
- Temperature (ºF or ºC): This column lists the temperature of the refrigerant. Usually displayed in Fahrenheit, but can also be shown in Celsius.
- Pressure (PSIG): This column shows the corresponding pressure in pounds per square inch gauge (PSIG). It indicates the pressure relative to atmospheric pressure.
Some charts may also include additional information, such as:
- Absolute Pressure (PSIA): The pressure relative to a perfect vacuum. PSIA = PSIG + Atmospheric Pressure (approximately 14.7 PSI at sea level).
- Vapor Volume (cu ft/lb): The volume occupied by one pound of R22 vapor at a given temperature and pressure.
- Liquid Volume (cu ft/lb): The volume occupied by one pound of R22 liquid at a given temperature and pressure.
For most practical HVAC work, you'll primarily use the temperature and pressure columns.
How to Read an R22 PT Chart: A Step-by-Step Guide
- Identify the refrigerant: Ensure you're using the correct PT chart for R22. Using a chart for a different refrigerant will give you inaccurate readings.
- Measure the temperature: Use a reliable thermometer or temperature probe to measure the temperature of the refrigerant line. The best places to measure are the suction line (low-pressure side) and the liquid line (high-pressure side).
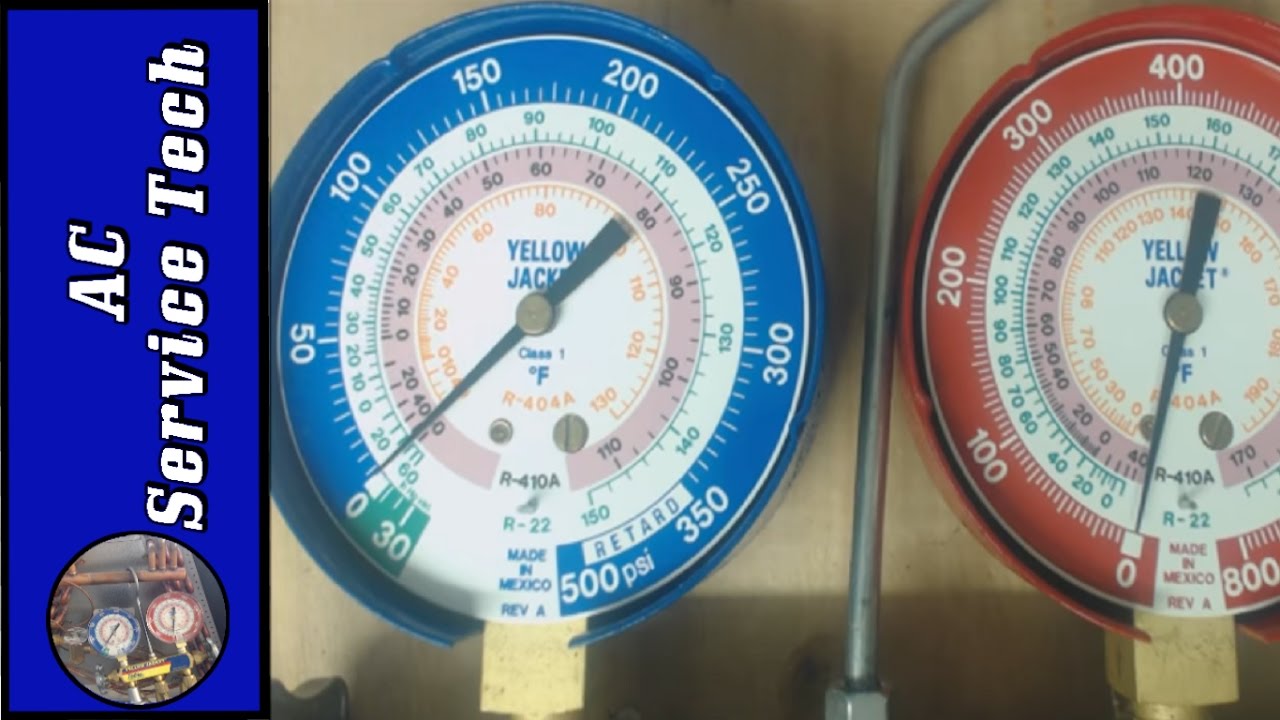
- Measure the pressure: Connect a manifold gauge set to the appropriate service ports on your HVAC system. Make sure the gauges are properly calibrated. Read the pressure on both the low-pressure and high-pressure gauges.
- Find the temperature on the chart: Locate the temperature reading you obtained in step 2 in the temperature column of the R22 PT chart.
- Find the corresponding pressure: Look across the row from the temperature you found to the pressure column. This is the expected pressure for R22 at that temperature in a saturated state.
- Compare your readings: Compare the pressure reading from the chart to the pressure you measured on your gauges in step 3.
Example Scenario
Let's say you're checking the suction line (low-pressure side) of an R22 air conditioner. You measure the temperature of the suction line to be 40°F. You connect your manifold gauges and read the low-side pressure to be 68 PSIG.
Now, you consult your R22 PT chart. You find 40°F in the temperature column and look across to the pressure column. You see that the corresponding pressure for R22 at 40°F is approximately 68 PSIG. In this case, your measured pressure closely matches the pressure on the PT chart. This indicates that your system likely has a correct refrigerant charge on the low side.
Interpreting the Results
The comparison between your measured values and the PT chart values is crucial for diagnosing HVAC system problems.
- Pressure is too low: If the pressure is significantly lower than the PT chart indicates for the measured temperature, it suggests a refrigerant leak, restricted airflow, or a faulty compressor.
- Pressure is too high: If the pressure is significantly higher than the PT chart indicates for the measured temperature, it could indicate overcharging of refrigerant, non-condensables in the system (like air), or a restricted condenser coil.
- Pressures are within range: If both high and low side pressures align with the PT chart for their respective temperatures, the refrigerant charge is likely correct. However, this doesn't rule out other potential issues like a faulty compressor, TXV issues, or ductwork problems.
Important Note: The PT chart only provides a reference point. You must also consider other factors like superheat and subcooling to get a complete picture of the system's performance. Superheat refers to the temperature above the saturation point of the refrigerant vapor leaving the evaporator. Subcooling refers to the temperature below the saturation point of the refrigerant liquid leaving the condenser. These calculations provide more nuanced diagnostic information.
R22 Phase-Out and Alternatives
R22 is an ozone-depleting substance and is being phased out under the Montreal Protocol. Production and import of R22 in the United States has been banned since January 1, 2020. This means the price of R22 has increased significantly, and it may become difficult to obtain in the future.
Alternatives to R22 include:
- R-410A: A common replacement for R22 in new HVAC systems. However, it operates at higher pressures than R22 and is not a drop-in replacement.
- R-32: A refrigerant with lower global warming potential than R-410A. It's becoming increasingly popular in mini-split systems and is also not a drop-in replacement for R22.
- Retrofit refrigerants: Some refrigerants are designed to be retrofitted into existing R22 systems. However, these options often require modifications to the system and may not offer the same performance or efficiency as R22.
Consider the Costs: Retrofitting an R22 system with an alternative refrigerant can be expensive, and the long-term performance may not be optimal. Replacing the entire system with a new unit that uses a more environmentally friendly refrigerant (like R-410A or R-32) is often the best long-term solution.
Superheat and Subcooling: Advanced Diagnostics
While the PT chart is a good starting point, experienced technicians use superheat and subcooling calculations to get a more accurate assessment of system performance. These measurements help determine if the system is efficiently utilizing the refrigerant and if there are any restrictions or inefficiencies in the evaporator or condenser coils.
Superheat
Superheat is the temperature difference between the actual temperature of the refrigerant vapor leaving the evaporator coil and the saturation temperature (as determined by the PT chart) at the evaporator pressure. High superheat indicates that the evaporator isn't being fully utilized, potentially due to low refrigerant charge or a restriction. Low or zero superheat suggests the evaporator is being overfed with liquid refrigerant, potentially leading to liquid refrigerant entering the compressor, which can cause damage.
Subcooling
Subcooling is the temperature difference between the saturation temperature (as determined by the PT chart) at the condenser pressure and the actual temperature of the refrigerant liquid leaving the condenser coil. High subcooling indicates that the condenser is effectively rejecting heat and that the system may be overcharged. Low subcooling suggests that the condenser isn't fully rejecting heat, possibly due to low refrigerant charge, airflow restrictions, or a dirty condenser coil.
Conclusion
Understanding how to read an R22 PT chart is a fundamental skill for anyone working with HVAC systems. While R22 is being phased out, many existing systems still rely on it, and this knowledge remains relevant for maintenance and troubleshooting. Remember to consider other factors like superheat and subcooling for a more comprehensive system diagnosis. For homeowners and facility managers, knowing the basics of PT charts allows you to communicate more effectively with HVAC technicians and make informed decisions about the maintenance and eventual replacement of your HVAC equipment. As systems age, proactive replacement with more modern and efficient units is often the most cost-effective strategy in the long run. Always consult with a qualified HVAC professional for any repairs or replacements involving refrigerant.