How To Use R134a Pressure Temperature Chart

The R134a Pressure Temperature (P/T) chart is an indispensable tool for anyone working with air conditioning and refrigeration systems that use R134a refrigerant. Whether you're a seasoned HVAC technician or a DIY enthusiast tackling a car AC repair, understanding and correctly using this chart is crucial for accurate diagnosis and proper system charging. This guide will break down the R134a P/T chart, explaining how to use it effectively and safely.
What is R134a Refrigerant?
Before diving into the chart itself, let's briefly define R134a. R134a is a hydrofluorocarbon (HFC) refrigerant commonly used in automotive and residential air conditioning systems. Think of refrigerant as the 'blood' of your AC system, carrying heat from inside to outside. It absorbs heat when it evaporates in the evaporator (inside the car or house) and releases heat when it condenses in the condenser (outside the car or house).
Why Use R134a?
R134a replaced older refrigerants like R-12 due to its lower ozone depletion potential. While R134a is now being phased out in favor of even more environmentally friendly refrigerants (like R-1234yf in some newer vehicles), it's still widely used and you're likely to encounter it when servicing older systems.
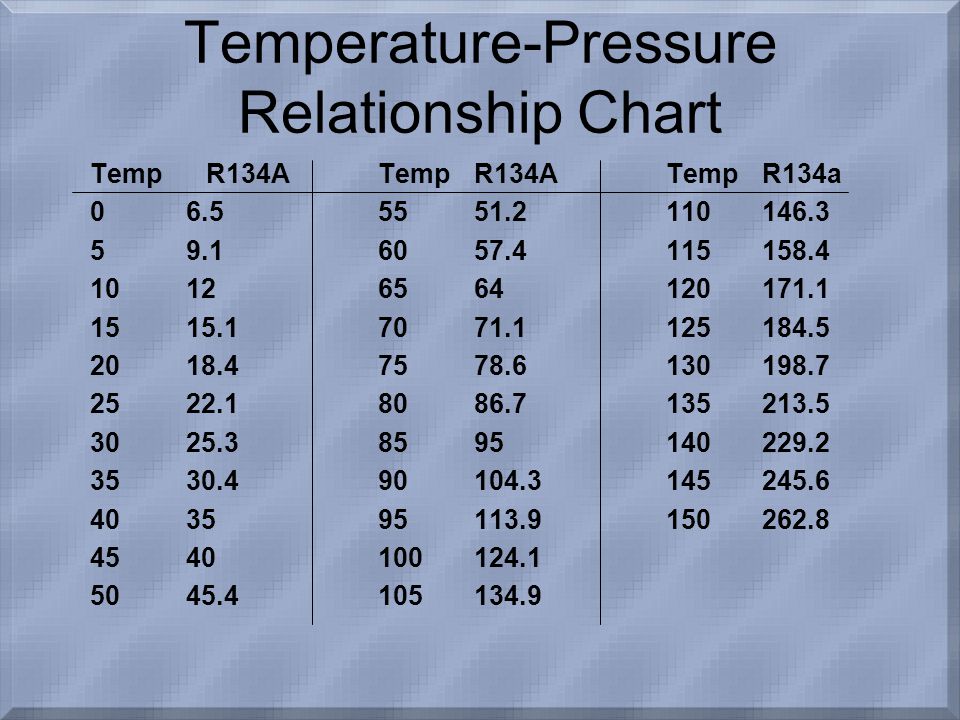
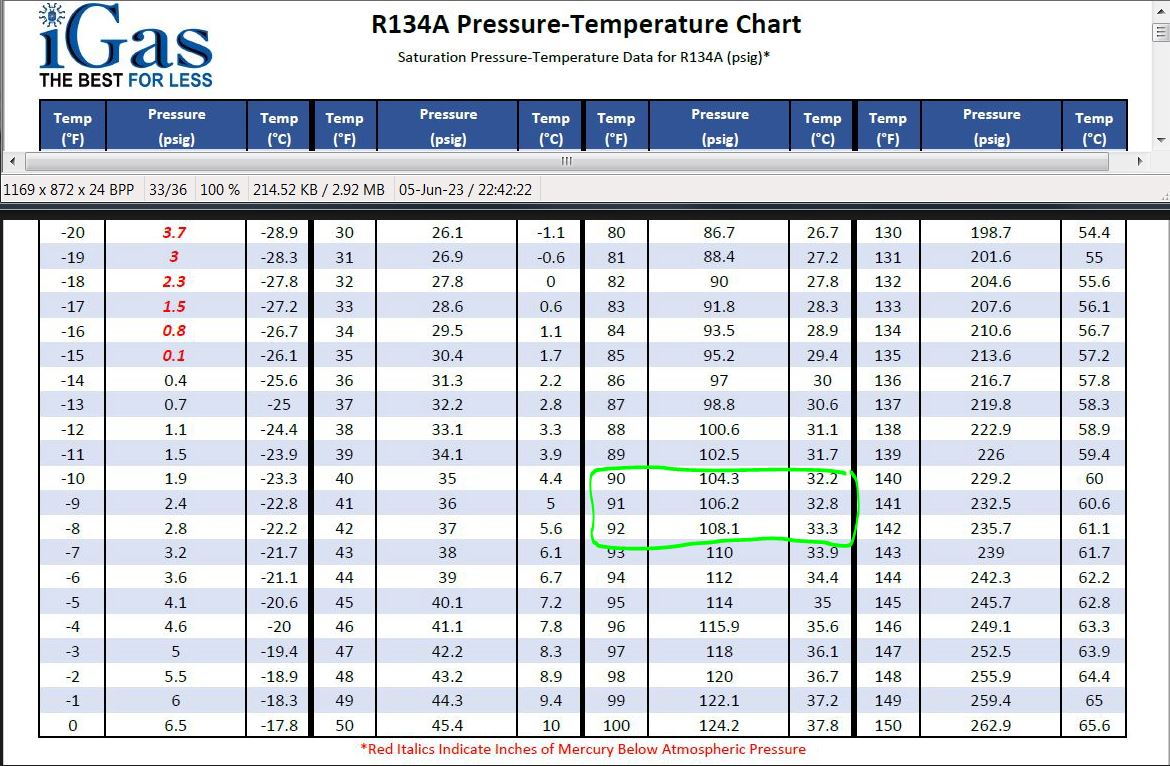
Understanding the R134a Pressure Temperature Chart
The R134a P/T chart shows the relationship between the pressure and temperature of R134a when it's in a saturated state. A saturated state simply means that the refrigerant is at its boiling point for a given pressure (or vice versa). This relationship is fundamental to how air conditioning systems work.
The chart typically has two axes:
- Pressure (PSI or kPa): Usually shown on the vertical axis. PSI stands for pounds per square inch, a common unit of pressure measurement. kPa stands for kilopascals, the metric unit of pressure.
- Temperature (°F or °C): Usually shown on the horizontal axis. °F represents degrees Fahrenheit, and °C represents degrees Celsius.
The chart itself is a curve or a series of data points that plot the specific pressure at which R134a will change state (boil or condense) at a given temperature. This curve is specific to R134a; other refrigerants will have different P/T charts.
What the Chart Tells You
The P/T chart tells you the following:
- Saturation Temperature at a Given Pressure: If you know the pressure of the refrigerant in the system, you can use the chart to determine the temperature at which it should be boiling or condensing.
- Saturation Pressure at a Given Temperature: Conversely, if you know the temperature of the refrigerant, you can determine the pressure it should be at.
This information is critical for diagnosing problems. For example, if the pressure is too high for a given temperature, it could indicate a problem like a blockage in the system, a non-condensable gas contamination (like air), or an overcharge of refrigerant. If the pressure is too low, it could indicate a leak or undercharge.
How to Use the R134a P/T Chart: Step-by-Step
Here's a step-by-step guide on how to use the R134a P/T chart effectively:
- Get Your Tools Ready: You'll need a set of manifold gauges (with hoses that connect to the AC system), a thermometer (or temperature probe), and the R134a P/T chart. Ensure your manifold gauges are properly calibrated.
- Connect Your Gauges: Connect the manifold gauges to the high and low-pressure service ports on the AC system. Typically, the blue hose connects to the low-pressure side, and the red hose connects to the high-pressure side. The yellow hose is usually connected to a refrigerant source or a vacuum pump.
- Read the Pressure: With the system running (or at least at rest and allowed to equalize), read the pressure on both the high and low-pressure gauges. Note these readings.
- Measure the Temperature: Use a thermometer or temperature probe to measure the temperature of the refrigerant line near the low-pressure service port. The closer you can get to the service port the more accurate your reading will be. Accuracy is paramount here.
- Find the Corresponding Temperature on the Chart: Locate the temperature you measured on the horizontal axis of the R134a P/T chart.
- Find the Saturation Pressure: From the temperature you located, draw a vertical line upwards until it intersects the R134a curve (or follow the data point for that temperature). The pressure value corresponding to this intersection on the vertical axis is the expected saturation pressure for that temperature.
- Compare Measured Pressure to Chart Value: Compare the pressure you measured on the low-pressure gauge (step 3) to the saturation pressure you found on the chart (step 6). This is the crucial comparison.
- Repeat for High-Pressure Side (If Needed): Repeat steps 4-7 for the high-pressure side, measuring the temperature near the condenser and comparing the high-pressure gauge reading to the chart value.
- Analyze the Results: Now you can analyze the results. Consider the following:
- If the measured pressure is close to the chart value: This suggests that the system is operating normally (at least in terms of pressure and temperature).
- If the measured pressure is significantly higher than the chart value: This could indicate:
- Overcharge: Too much refrigerant in the system.
- Blockage: Restriction in the refrigerant flow, causing pressure to build up.
- Non-Condensable Gas: Air or other gases contaminating the system.
- Inefficient Condenser: Condenser not effectively dissipating heat.
- If the measured pressure is significantly lower than the chart value: This could indicate:
- Undercharge: Not enough refrigerant in the system (likely due to a leak).
- Restricted Evaporator: Evaporator not receiving enough refrigerant.
- Compressor Issues: Compressor not pumping efficiently.
Important Considerations and Safety Precautions
Using the R134a P/T chart is a valuable skill, but it's essential to keep these points in mind:
- Ambient Temperature Affects Readings: The P/T chart provides a baseline. Ambient temperature (the temperature around the system) greatly influences the readings. A very hot day will result in higher pressures than a cool day. Consider using a target superheat/subcooling charging method for more precise results.
- Superheat and Subcooling: Understanding superheat and subcooling enhances diagnostic accuracy. Superheat refers to the temperature above the saturation temperature after the refrigerant has completely evaporated. Subcooling refers to the temperature below the saturation temperature after the refrigerant has completely condensed. These measurements provide insight into the system's efficiency and charge level.
- System Condition Matters: The P/T chart is just one piece of the puzzle. The overall condition of the AC system (compressor health, condenser efficiency, evaporator airflow) also impacts the readings.
- Leak Detection is Key: If you suspect a leak (based on low-pressure readings), use a refrigerant leak detector to pinpoint the source.
- Vacuum the System: After repairs, always vacuum the system to remove air and moisture before recharging. Moisture is detrimental to AC systems.
- Proper Charging Procedures: Follow the vehicle manufacturer's recommendations for the correct refrigerant charge. Overcharging or undercharging can damage the system.
- Safety First: Refrigerant can cause frostbite. Wear appropriate safety gear (gloves, eye protection) when working with AC systems. Never release refrigerant into the atmosphere – it's illegal and harmful to the environment.
- Use a Reliable P/T Chart: Ensure you're using a trusted and accurate R134a P/T chart. Many are available online, but verify their source.
Beyond the Basics: Advanced Diagnostics
The P/T chart is a foundational tool, but more advanced diagnostic techniques can provide a deeper understanding of system performance.
- Superheat Charging: This method is commonly used on systems with a TXV (thermostatic expansion valve). You measure the superheat at the evaporator outlet and adjust the refrigerant charge until the superheat is within the manufacturer's specified range.
- Subcooling Charging: This method is typically used on systems with a fixed orifice tube. You measure the subcooling at the condenser outlet and adjust the refrigerant charge until the subcooling is within the specified range.
- Analyzing High and Low Side Pressures Together: The relationship between the high and low side pressures provides clues about compressor efficiency, condenser performance, and evaporator issues. For example, abnormally high high-side pressure and normal low-side pressure could indicate a condenser problem.
Conclusion
The R134a Pressure Temperature chart is a fundamental tool for diagnosing and servicing AC systems. By understanding the principles behind the chart and following the steps outlined in this guide, you can effectively troubleshoot AC problems and ensure your system is operating optimally. Remember to prioritize safety and consult with a qualified technician if you're unsure about any aspect of the repair. Practice, careful observation, and a systematic approach are key to mastering AC system diagnostics.